
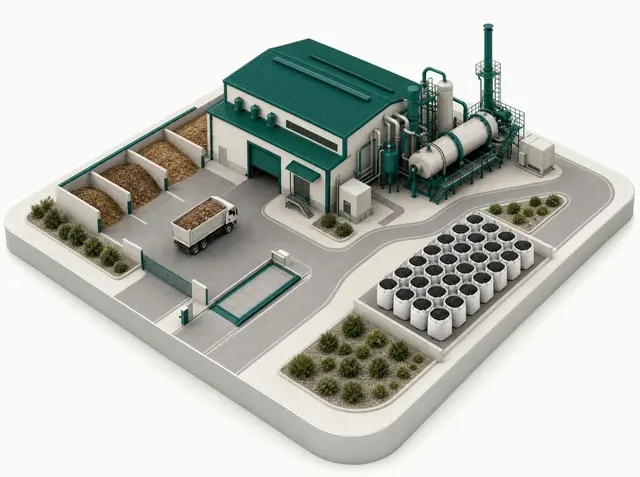
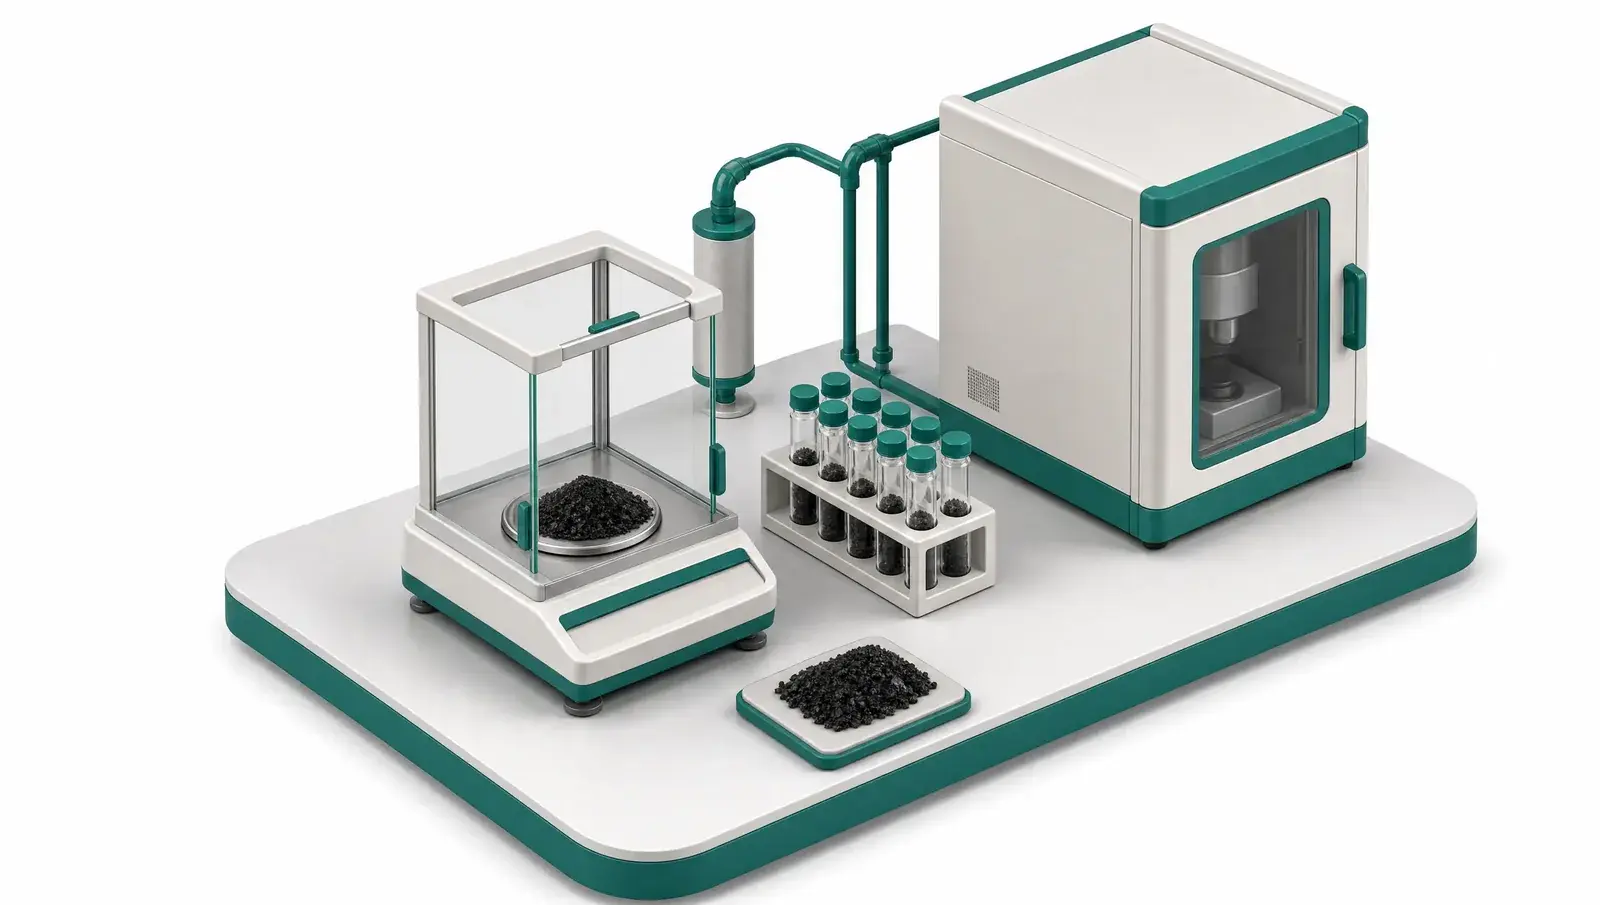
Every carbon credit is a sentence of the form: one tonne of CO₂ was removed from the atmosphere and will stay out of it. For that sentence to be worth money, or worth citing in a sustainability report, it has to be true in a way an auditor can check. This article walks through how that truth is established for biochar, using the method we are building our own operations around.
The short version: two independent measurement chains, one conservative rule for resolving them, and a paper trail from every certified number back to a raw record.
Methodology v1.0 · published 12 July 2026 · last revised 16 July 2026
How to cite: Recarbono, 'How we count a tonne', counting methodology v1.0, July 2026. https://www.recarbono.com/insights/how-we-count-a-tonne
Where does a certified tonne actually come from?
No one weighs CO₂ directly. A biochar removal is calculated from four measured quantities, following registry methodologies such as CSI's Global C-Sink standard and Puro.earth's biochar methodology [2][3]:
Fig. 1: The accounting chain, from batch to net removal
Each factor is measured differently, fails differently, and is verified differently. The craft of honest carbon accounting is deciding what to do when they don't agree.
What the sensors see
Instruments on the production line record continuously: mass in and out, reactor temperature, moisture, run boundaries. This stream does two jobs. It defines the batch (the unit everything else attaches to) and it flags anomalies in real time: a drying fault, a temperature excursion, a mass imbalance. Continuous data is superb at catching drift and defining boundaries. It is not, on its own, proof of carbon content.
What the lab measures
Proof comes from physical samples, analysed per batch: organic carbon fraction (how much of the batch is actually carbon), the H/C ratio (the molar hydrogen-to-carbon ratio; below 0.7 qualifies as biochar, and the lower it is, the more aromatic and durable the carbon [1]), and the safety panel of heavy metals and PAHs that standards like the EBC require [1]. Permanence can also be measured directly from the carbon's structure by random reflectance (R₀) petrography, the method our highly specialised accredited laboratory partners are equipped for, rather than inferred.
When they disagree, who wins?
Now the important case. The sensor chain implies one carbon figure for the batch; the laboratory reports another. They will rarely match to the decimal: different instruments, different sampling, different error bars. Our rule is fixed in advance:
The conservative value is carried forward. Uncertainty is deducted, not averaged. Every adjustment is logged.
Fig. 2: Sensor estimate vs lab result: the conservative line is carried forward
Worked through a batch, the rule looks like this; figures are illustrative, chosen for round numbers rather than taken from operations:
Fig. 3: Illustrative batch walk-through (not operational data)
| Step | Value | Rule applied |
|---|---|---|
| Batch mass (weighbridge) | 10.00 t | calibrated scale record |
| Organic C (sensor-derived) | 83% | flagged, not used |
| Organic C (laboratory) | 80% | conservative value carried |
| Carbon in batch | 8.00 t C | 10.00 × 0.80 |
| Gross CO₂e (× 44/12) | 29.33 t | stoichiometry |
| Permanence factor | × 0.80 | Portuguese soil temperature |
| Lifecycle deduction | − 2.10 t | process & logistics emissions |
| Uncertainty deduction | − 0.86 t | deducted, never averaged |
| Net certified removal | 20.50 tCO₂e | rounded down at each step |
Notice what the rule costs: the sensor chain suggested three points more carbon, and the claim ignores it. Over a year of batches that is real volume, deliberately left unclaimed.
Why under-claiming builds the market
A removal market only works if a tonne means a tonne. Buyers are answerable to auditors, boards and, increasingly under frameworks like the EU CRCF [4], to regulators. The cheapest way to lose their trust is a credit that shrinks under scrutiny; the most durable way to earn it is a credit that grows. Conservative accounting converts measurement uncertainty into a margin of safety instead of a marketing number, and that is precisely the accounting a young market needs from its suppliers.
Common questions
Why not average the sensor and the lab?
Averaging treats a disagreement as noise. In carbon accounting, a disagreement is information: it means at least one measurement chain has an error you haven't found yet. Carrying the conservative value forward under the applicable certification methodology keeps the claim safe while the discrepancy is investigated.
What happens to the tonnes you don't claim?
Nothing, and that's the point. Carbon held back by conservative rounding is never issued, never sold and never double-counted. It is a safety margin between what we can prove and what we sell.
Who verifies the verification?
Three layers: the laboratory operates toward ISO/IEC 17025 accreditation, the registry methodology (Puro.earth, or Isometric) defines the accounting rules, and independent third-party auditors review issuance. Our records exist so that any of them can retrace every figure to its raw measurement.
Changelog
Revisions to this method are made here, in public, and follow the same rule as the tonnes: unless new evidence justifies otherwise, a number only moves downward or narrower.
- 2026-07-12v1.0: methodology published in full (initial public version).
- 2026-07-16Net tCO₂e-per-tonne range canonicalised site-wide at 1.9–2.3. It had previously been stated inconsistently across pages; the demonstration batch's net 1.99 and this article's worked example of 2.05 both sit inside the range.
- 2026-07-16Mass-reduction claim narrowed from 70–90% to 75–90%: the narrower, more defensible range.
References
- European Biochar Certificate (EBC): Guidelines for a Sustainable Production of Biochar
- Carbon Standards International: Global C-Sink / C-Sink Biochar standard
- Puro.earth: Biochar Methodology (CORC issuance)
- European Commission: Carbon Removals and Carbon Farming (CRCF) Regulation (EU) 2024/3012
- ISO/IEC 17025: General requirements for the competence of testing and calibration laboratories
Batch figures in Fig. 3 are illustrative. Methodology described is the standard our operations are being built to; parameters are set per registry at issuance. See also the glossary.